EasyUI
PivotGrid
Extension » PivotGrid

Usage Example
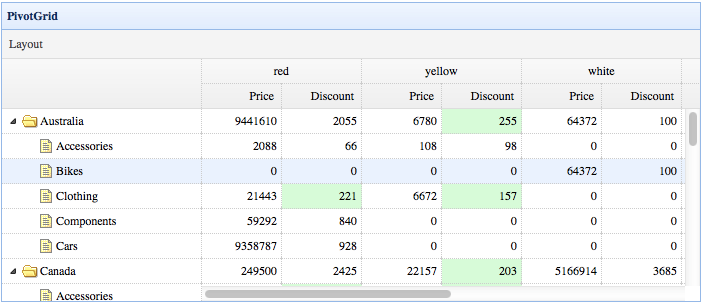
Create the pivot grid
Properties
The properties extend from treegrid, below is the added properties for pivotgrid.
| Name | Type | Description | Default |
|---|---|---|---|
| frozenColumnTitle | string | The title for the frozen column. | |
| valueFieldWidth | number | The column width of the value fields. | 80 |
| valuePrecision | number | The precision of the value fields. | 0 |
| valueStyler | function(value,row,index) | The cell styler function for the value fields. | |
| valueFormatter | function(value,row,index) | The cell formatter function for the value fields. | |
| headerStyler | function(title,col) | The header cell styler function for the header fields. | |
| headerFormatter | function(title,col) | The header cell formatter function for the header fields. | |
| pivot | object |
The pivot grid configuration, contains the following properties: rows: array, the rows displayed on the left. columns: array, the columns displayed above the grid. values: array, the value fields displayed under the columns. filters: array, the filters. filterRules: object, the filter rules. aggregate: object, the aggregate value for the rows and columns. |
|
| i18n | object |
The i18n configuration, contains the following items: fields: the title of the fields region. filters: the title of the filters region. rows: the title of the rows region. columns: the title of the columns region. ok: the title of the OK button. cancel: the title of the CANCEL button. |
|
| defaultOperator | string | The default operator on the value columns. | sum |
| operators | object |
The operators on the value fields, available options are:'sum','count','max','min'.
Code example:
//implement the 'sum' operator
$.extend($.fn.pivotgrid.defaults.operators, {
	sum: function(rows, field){
		var opts = $(this).pivotgrid('options');
		var v = 0;
		$.map(rows,function(row){
			v += parseFloat(row[field])||0;
		});
		return v.toFixed(opts.valuePrecision);
	}
});
|
Events
The events below extend from treegrid.
Methods
The methods below extend from treegrid.
| Name | Parameter | Description |
|---|---|---|
| options | none | Return the options object. |
| getData | none | Get the loaded data. |
| layout | none | Open the layout dialog that allows the user to change the cube at runtime. |
| toArray | rows | Export the array data. |
| toExcel | param |
Export to the excel file.
Code example:
$('#pg').pivotgrid('toExcel', {
    filename: 'pivotgrid.xls',
    worksheet: 'Worksheet',
    caption: 'Caption'
});
// export with customized rows
$('#pg').pivotgrid('toExcel', {
    filename: 'pivotgrid.xls',
    worksheet: 'Worksheet',
    caption: 'Caption',
    rows: rows
});
|
| toCsv | param |
Export to the csv file.
Code examples:
$('#pg').pivotgrid('toCsv', 'pivotgrid.csv');
// export with customized rows
$('#pg').pivotgrid('toCsv', {
    filename: 'pivotgrid.csv',
    rows: rows
});
|
